Demand and supply
July 28 2015
I can never forget this day, this has been so far the happiest day ever. I am sure you would be guessing what happened today innit?. Let me fill you in. My sister qualified as a medical doctor…yaaay…after so much hardship and suffering. They put them through hell in that useless school. Imagine, 37 out of about 140 students are repeating, and it is not their fault; during their final year, they were numerous strikes, Ebola out break and many other things.
Instead of them to now have clemency on them (because getting to 600 level on its own is no mean feet),they still decide to fail many of them. Wickedness of the highest order. Nonsense. I feel so sad for them, but I am super happy for my sister. We are only two by our parents, and I love her so much.
After the celebrations, I read about demand and supply. Here it goes:
Demand
What is a demand?
Demand is the specific quantity of goods and services demanded by a willing and able buyer at a particular period of time.
Demand function:
QDX = f(Px, I, Py)
Where
Px = Price of good x
I = Some measure of individual or average income per year
Py = Prices of related goods.
Complements: Increase in the price of automobiles will decrease the demand for gasoline (complement)
Substitutes: Increase in the price of one would increase the demand for the other.
To draw demand graphs, you may need to invert the equation to the price format instead of the demand especially for that of supply. To invert a demand fuction, take for example the following:
Qdd = 50 – 1.25p
Make p the subject of the formula
=
Q = 50 − 1.25 p
Divide through by 1.25
Q /1.25 = 40 − P
0.8Q = 40 – P
Nb: 1/1.25 = 0.80
Then make P the subject of the formula
P= 40 – 0.80Q
Shifts in and movements along demand and supply curves
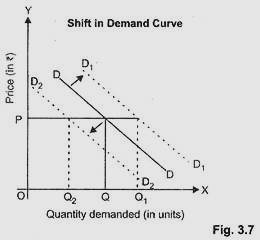
Change in demand: A shift in demand is caused by a change in one of the independent variables other than the price of the commodity. Such variables include taste, income, substitutes and so on.
For a change in demand, the demand curve shifts completely either to the left or to the right.
For an increase in demand, the demand curve shifts to the right and this means that for every possible price, a greater quantity is demanded. An increase in demand might be caused by:
• an increase in the number of consumers.
• an increase in consumers’ income (for a normal good) or a decrease in consumers’ income (for an inferior good).
• an increase in the price of a substitute good.
• a decrease in the price of a complementary good.
• an increase in preference for the product (i.e., the product becomes more popular).
• expectations (e.g., that the price will be higher in the future).
For a decrease in demand, the demand curve shifts to the left and this means that for every possible price, a lesser quantity is demanded. A decrease in demand might be caused by:
• A decrease in the number of consumers
• A decrease in consumers’ income (for a normal good) or an increase in consumers’ income (for an inferior good).
• A decrease in the price of a substitute good.
• An increase in the price of a complementary good.
• A decrease in preference for the product (i.e., the product becomes less popular).
Diagram of a change in demand
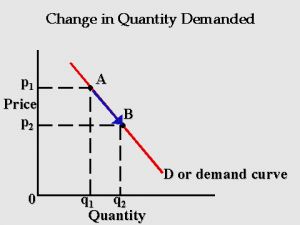
Change in quantity demanded is a movement along the same demand curve. Demand has an inverse relationship with price. Demand has a direct relationship with factors such as income, price of substitutes etc. A movement along the same demand curve indicates a change in the price which subsequently leads to a change in the quantity demanded.
For an increase in the quantity demanded for a product, the price of the product decreases and there would be a movement from one point on the demand curve to another point (further to the right) on the same demand curve. An increase in the quantity demanded is caused only by a change in the quantity demanded.
For a decrease in the quantity demanded for a product , the price of the product increases and ther would be a movement from one point on the demand curve to another point (further to the left) on the same demand curve. A decrease in quantity demanded is caused only by an increase in the price of the product.
Diagram of a change in quantity demand
SUPPLY
Supply is the willingness and ability of a producer to supply a specific quantity of a good or service at a particular period of time. In determining the quantity a producer would be willing to supply at a particular period of time, we have to take into cognizance a number of factors such as the price of the product, cost of inputs, technology being used, cost of labor, cost of other inputs and the production process itself.
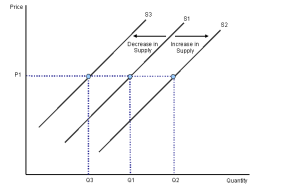
Change in supply: A change in supply is also caused by a change in one independent variable other than the market price. Such variables include wage rate, or the price of substitutes. In change in supply, the supply curve shifts either to the left or right. This means a new supply curve is formed either to the right or to the left of the normal one.
For an increase in supply, the supply curve shifts to the right and it means that at every possible price, a greater quantity is supplied. An increase in supply may be caused by :
• An increase in the number of sellers.
• A reduction in the cost of inputs (such as labor or electricity).
• A technological innovation that increases output (such as the development of disease resistant crops).
• An unusually good weather (for an agricultural product).
• Expectations (e.g., that the price will be lower in the future)
For a decrease in supply, the supply curve shifts to the left and it means that at every possible price, a lesser quantity is supplied. A decrease in supply may be caused by:
• A decrease in the number of sellers.
• An hike in the cost of inputs (such as labor or electricity).
• Bad climatic conditions eg (for an agricultural product).
• Expectations (e.g., that the price will be higher in the future can lead to hoarding to increase the price of the product)
Diagram of a change in supply
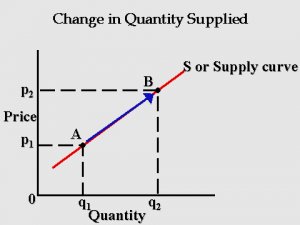
Change in quantity supplied is a movement along the same supply curve as a result of a change in the market price of the good to be sold. In an increase in the quantity supplied, the price of the product has increased and there would be a movement from one point on the supply curve to another point, which would be further to the right on the same supply curve.
For a decrease in quantity supplied, there is a decrease in the price of the product and there would be a would be a movement from one point on the supply curve to another point, which would be further to the left on the same supply curve.
Diagram of a change in quantity supplied
Equilibrium level
This is the level at which the quantity demanded equals the quantity supplied or the quantity suppliers are willing and able to supply at a particular period of time. Under the assumption that buyers compete for available goods on the basis of price only, and suppliers compete for sales on the basis of price, market forces will drive its price to its equilibrium level.
An example would be to imagine the allocation of resources to zinc production is not efficient, we have a disequilibrium situation where the quantity of steel supplied is greater than the demand at #1000. This would result in a build up of inventories at the wharehouse, with extra holding costs and security costs. Eventuaslly suppliers would get tired of the situation and start selling at a reduced price.
As the price falls, steel producers will reduce production and free up resources to be used in the production of other goods and services until equilibrium output and price are reached.
If zinc prices are lower than the excess equilibrium, suppliers would be discouraged to produce, inventories would be drawn down, which would put an upward pressure on the price of the product as buyers compete for the little copies they can grab.
This would motivate sellers to increase production when there is an increase in price, and buyers would decrease their purchases as price rises again.
Stable equilibrium is a situation whereby forces move price and quantity back towards equilibrium values when they deviate from those values. Prices above equilibrium results in excess supply and put downward pressure on price. While prices below equilibrium results in excess demand and put upward pressure on price.
Recommended Readings
Robert Pyndick., Daniel Rubinfield., Microeconomics (8th Edition)
Dominick Salvatore., Schaums outline of microeconomics
Paul Krugman., Robin wells., Microeconomics (4th edition)


When demand is shown on a graph, it has a peculiar shape that is distinctly known as the demand curve. This demand curve demonstrates the various prices and the demand for the product in respective to it.